
 3 months ago
253
3 months ago
253
PROTECT YOUR DNA WITH QUANTUM TECHNOLOGY
Orgo-Life the new way to the future Advertising by AdpathwayDisclaimer: This site is not affiliated with the National Hurricane Center, Hurricane Hunters, Storm Prediction Center, or National Weather Service. ALL forecasts herein are the result of my analysis, (to which you will see me at times, insert excerpts from various agencies due to the nature of the importance of the information) and I am solely responsible for the content. As ALWAYS, follow the National Hurricane Center, National Weather Service, and your local Emergency Management officials for emergency decisions. In addition, this is strictly a FORECAST OFFICE. I CANNOT make decisions regarding travel plans, etc. My purpose, is to provide you the information, based solely on information I analyze, and the accuracy of the information at hand of the time of analysis, so you may make informed decisions.
(T. F. “Storm” Walsh)
For those who have donated to my site, your help has been greatly appreciated. If you are not aware, donations to my site help pay for subscriptions to sites I use as well as software updates, which provide all the models and information used in my forecasts. To donate, please click the DONATE button to the right side of the page, or on the graphic of the dog. Any help you provide is immensely appreciated!
DONATIONS ACCEPTED AND APPRECIATED


I will reiterate, my forecasts are based on the available information at the time of analysis, and are only as accurate as the information analyzed and the solutions provided.
Good day everyone!
The forecast center is closed on Sunday’s.
The SPC has introduced a MARGINAL risk for severe thunderstorms in the DAY 2 and DAY 3 outlooks:
DAY 2 OUTLOOK (LINKED)
CSU – MLP AND NSSL ML DAY 2 PROBABILITIES

SPC DAY 3 OUTLOOK (LINKED)
CSU – MLP AND NSSL ML DAY 3 PROBABILITIES

CURRENT DAY 1 SEVERE WEATHER OUTLOOK
The Storm Prediction Center (SPC) has increased the severe risk and has issued an ENHANCED risk for severe thunderstorms in the current DAY 1 Outlook: ACROSS SOUTHERN ILLINOIS AND SOUTHERN INDIANA…
…SPC SUMMARY…
Severe thunderstorms including a few tornadoes, large hail and damaging wind gusts are expected across parts of the Midwest and lower Ohio Valley today. Elsewhere, storms may produce strong wind gusts over parts of coastal south-central California early today.
SPC DAY 1 SEVERE THUNDERSTORM OUTLOOK (LINKED FOR OUTLOOK TEXT)
TORNADO PROBABILITY
Probability of a tornado within 25 miles of a point. Hatched Area: 10% or greater probability of EF2 – EF5 tornadoes within 25 miles of a point.
HAIL PROBABILITY
Probability of one inch diameter hail or larger within 25 miles of a point.
DAMAGING THUNDERSTORM WIND PROBABILITY
Probability of damaging thunderstorm winds or wind gusts of 50 knots or higher within 25 miles of a point.
CSU – MLP DAY 1 FORECAST (CLICK FOR LARGER IMAGE)
NSSL ML DAY 1 PROBABILITY 

DAY1 PROBABILITY CONVERSION TABLE
SPC DISCUSSION EXCERPT:
…Midwest/Ohio Valley…
Recent surface analysis places a low over eastern KS with a dryline extending southwestward from this low through central OK and into west TX. A warm front also extends eastward from this low across central MO through central IL and central IN, separating the moistening airmass south from the stable and cold airmass north. Surface observations currently show mid 50s dewpoints through southern IL and southern IN, with the 60s dewpoints farther south into western KY. This surface low is forecast to progress northeastward across central MO and into west-central IL today before continuing northeastward into the southern Lake Michigan vicinity by early tomorrow. Continued northward moisture advection is anticipated as this low progresses, but this low-level moistening will be countered somewhat by boundary-layer mixing, resulting in some uncertainty to how high the dewpoints will reach across the OH Valley this afternoon. General consensus places upper 50s dewpoints into the I-70 corridor by the late afternoon.
These increasing dewpoints coupled with cold temperatures aloft and afternoon temperatures in the upper 60s/low 70s should result in modest airmass destabilization within the warm sector, despite a relatively warm layer between 850-700 mb. In addition to improving thermodynamics, the deep-layer southwesterly flow is forecast to strengthen as well. The strongest mid-level flow will likely be displaced just south of the better thermodynamics, but forecast shear profiles are still quite robust across the OH Valley. The general expectation is for this robust vertical shear (i.e. effective bulk shear over 50 kt this afternoon) to somewhat compensate for the more modest buoyancy, resulting in an organized storm mode and supercells.
The dryline will likely remain west of this region during the afternoon, with the lift over the warm sector provided by a subtle lead shortwave currently moving through southern MO. This shortwave should interact with the warm sector across the OH Valley this afternoon, supporting thunderstorm development. Overall coverage is not expected to be high, but any storms that do mature could produce all severe hazards, including tornadoes. Additionally, the robust shear suggests that once a storm matures, it could persist for several hours. Given this updraft persistence in the presence of veering low-level wind profiles, a strong (EF2+) tornado is possible.
The following maps are from NADOCAST for tornado and hail probabilities.
12Z NADOCAST TORNADO PROBABILITY (CLICK FOR LARGER IMAGE)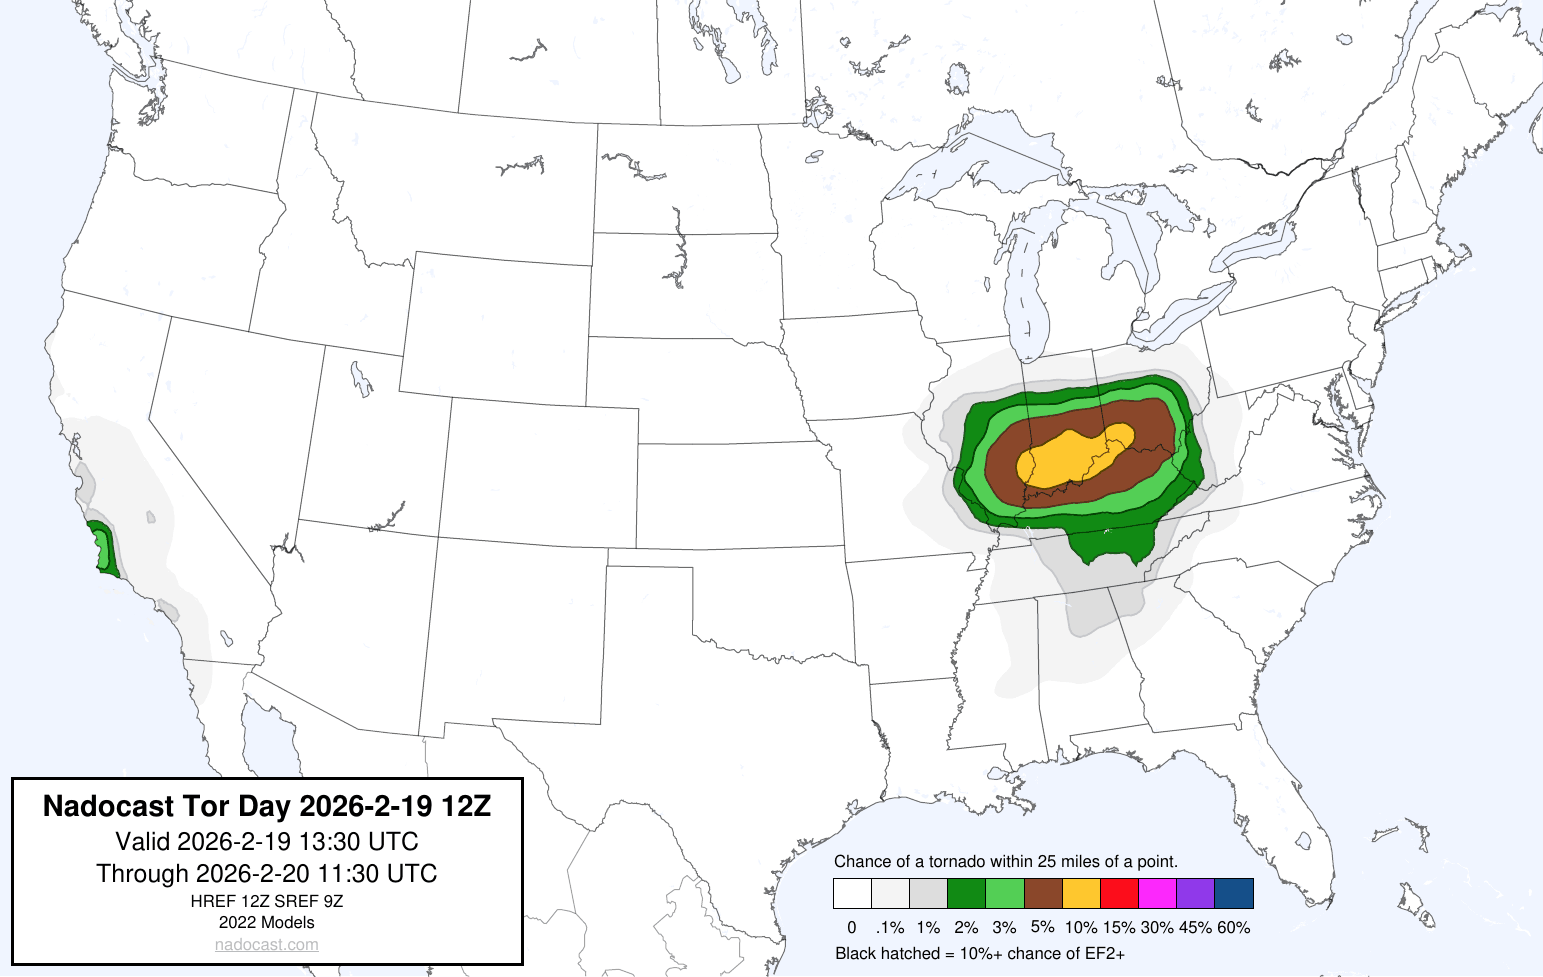
12Z NADOCAST SIGTOR PROBABILITY (CLICK FOR LARGER IMAGE)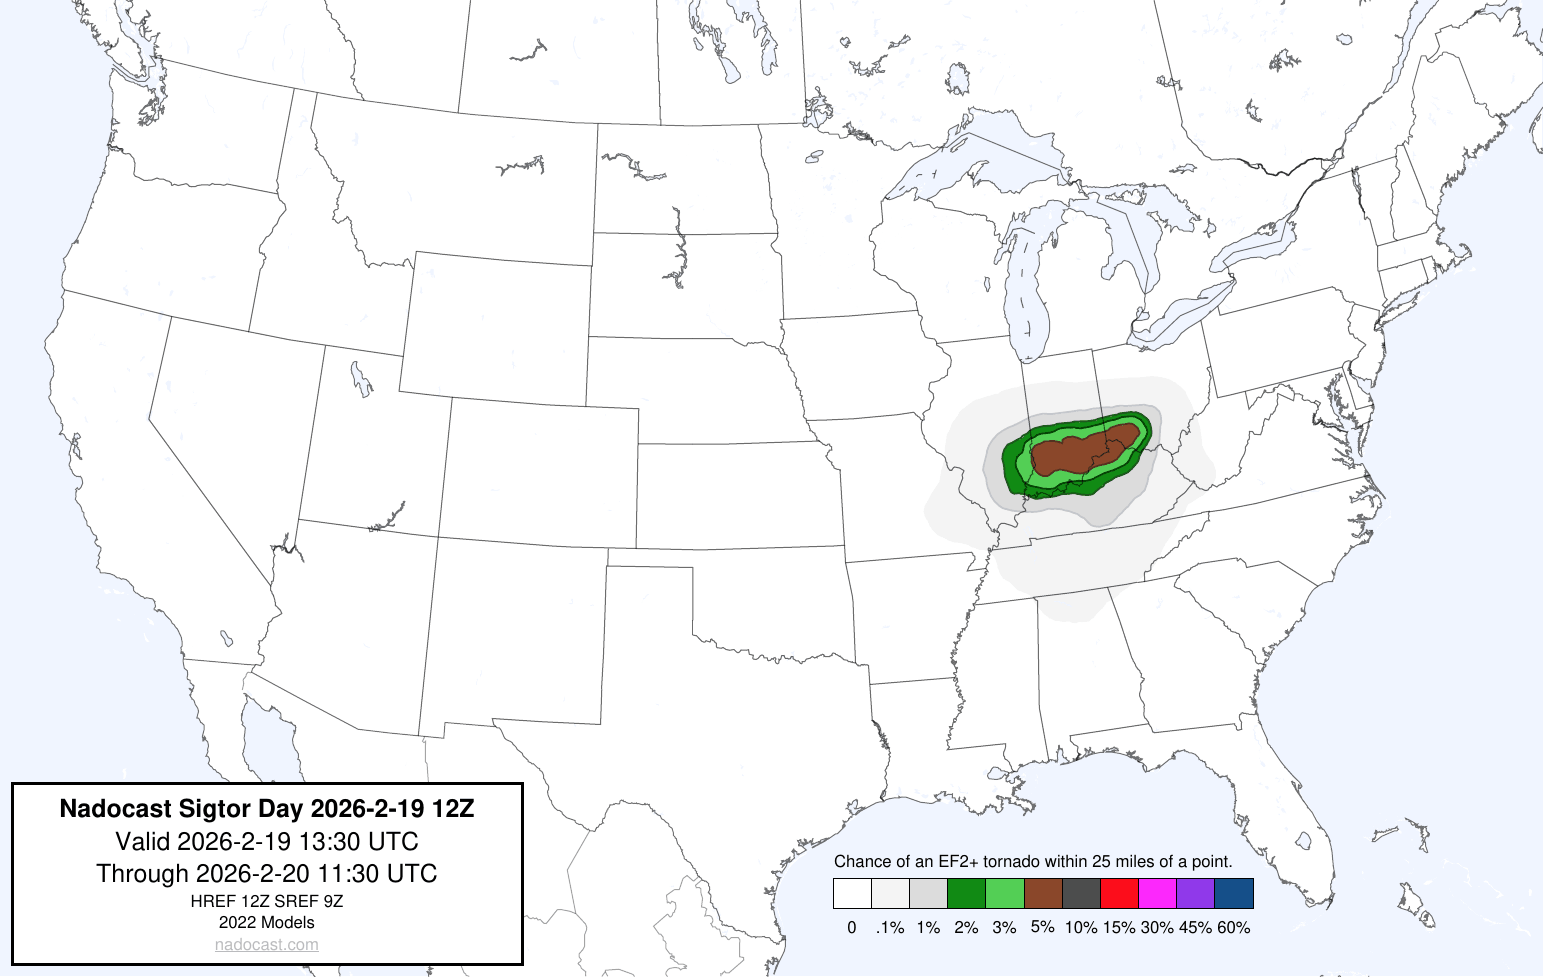
12Z NADOCAST HAIL PROBABILITY (CLICK FOR LARGER IMAGE)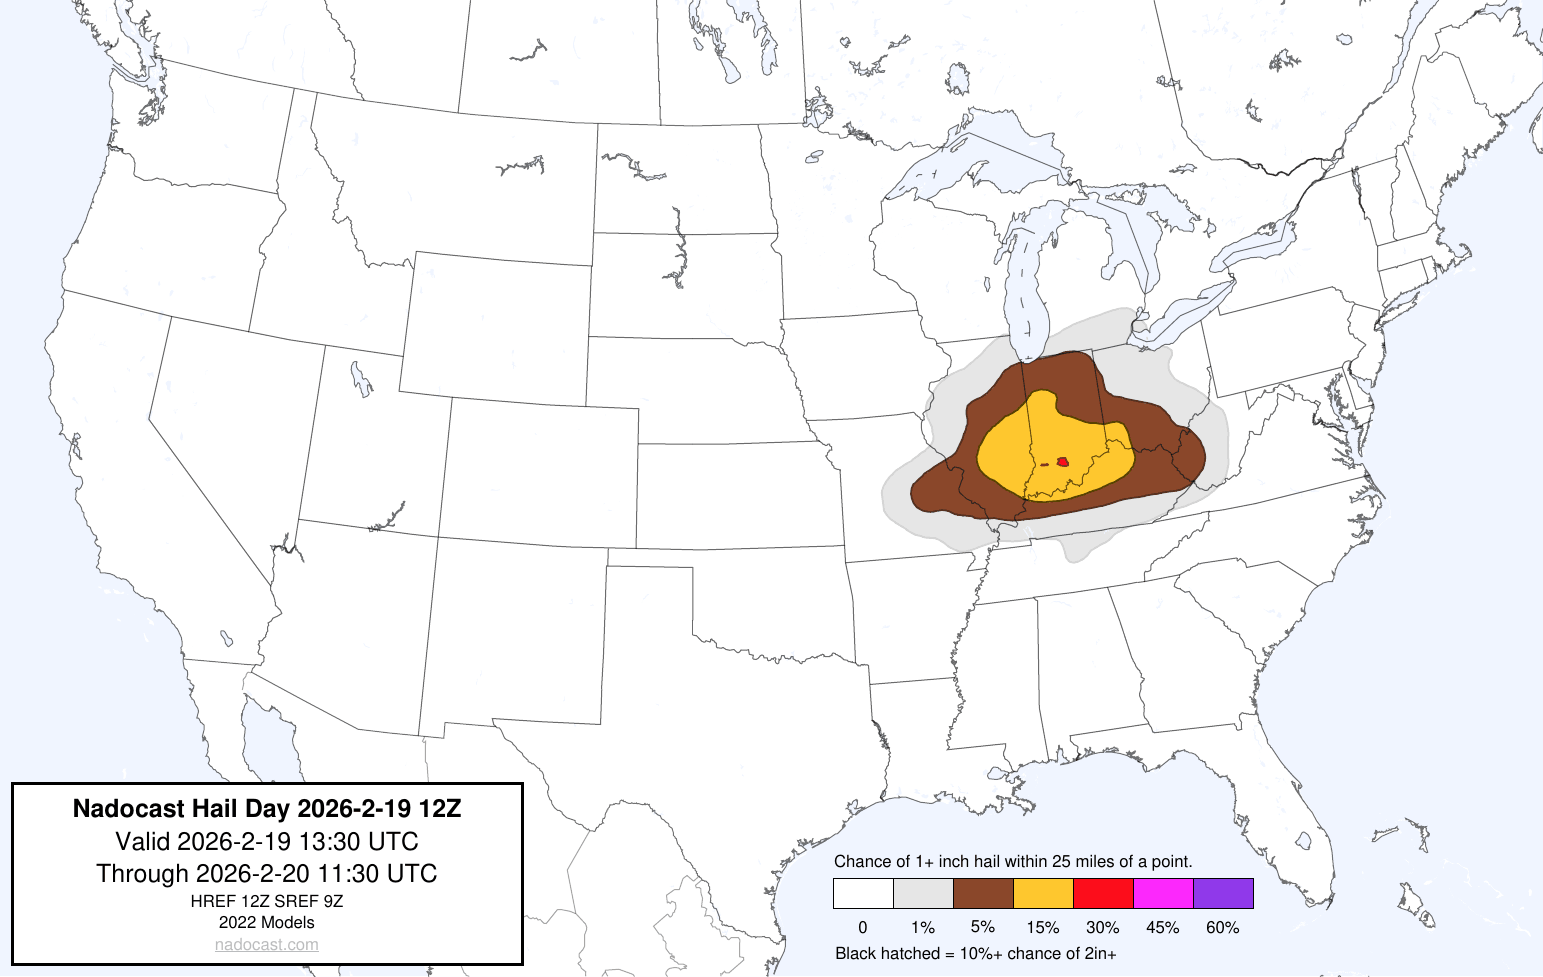
12Z NADOCAST SIGHAIL PROBABILITY (CLICK FOR LARGER IMAGE)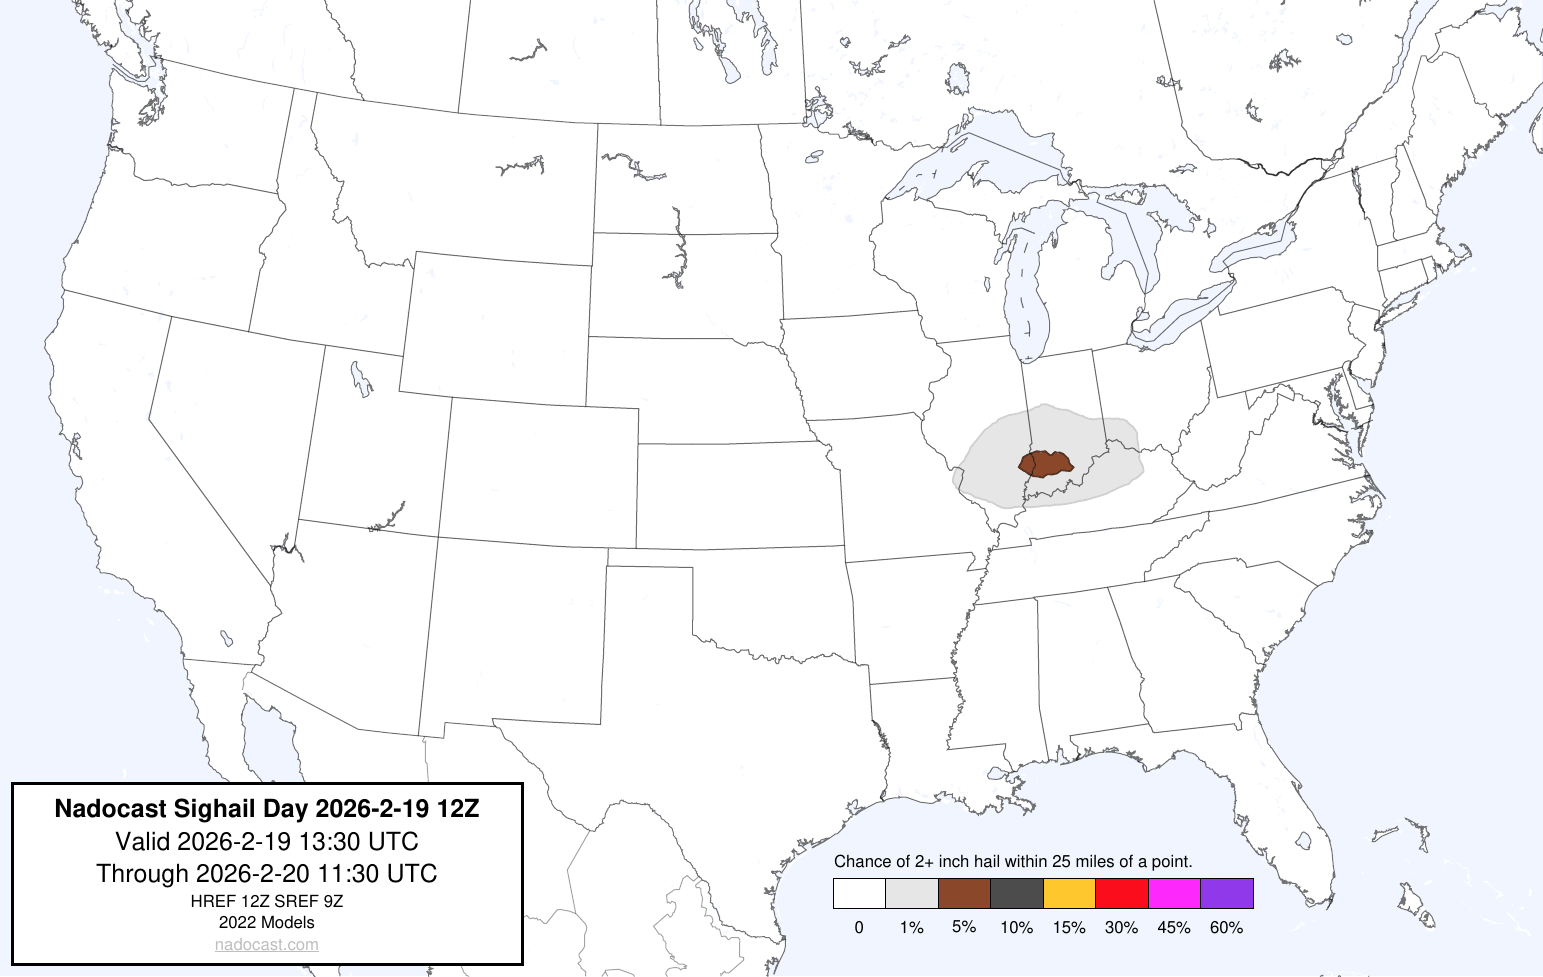
Based on my analysis of the severe weather indices, the forecast calls for a moderately unstable atmosphere at the moment. Indices indicate severe thunderstorms may be possible during the early afternoon, through early to mid evening. All severe risks are likely today, with the strongest being the tornado threat. Analysis of models tends to indicate the strongest indices should be located over central Indiana and a portion of eastern Illinois within the ENHANCED risk outline and into the portion of the SLIGHT risk outline just surrounding the ENHANCED risk. Based on analysis of deep layer shear, increase in MLCAPE values, 0 – 3km SRH max of 350 m2 / s2, veering winds, and EHI maximum approaching 3.0, the probability for isolated strong tornado activity (EF2+) exists within the 10% hatched TORNADO outline). Based on an increase of Lifted Indices from yesterday, and increase in CAPE values, large hail is in the forecast. Damaging thunderstorm winds are likely based on deep layer wind shear and strong DCAPE.
Based on analysis of model animations, the current outlook, and analysis of indices, the strongest storms and indices should occur approximately between 1:00 P.M. CST through 6:00 P.M. CST. with storms continuing into the evening hours. The animations further on in the synopsis run from 1:00 P.M. CST until 11:00 P.M. CST. Please visit the SPC homepage via the link provided for any changes to the forecast today.
CAPE VALUES FORECAST
DEW POINT FORECAST
Indices were analyzed from the NAM 3KM, CIPS DETERMINISTIC, and SPC SREF model guidance.
The following were the forecast parameters and indices analyzed this morning. Bear in mind, MAXIMUM indices recorded below are for the time of peak intensity. Some indices meanings are posted below the indices themselves, and the NWS page containing a more extensive explanation can be accessed further on in the synopsis:
SBCAPE: 500- 1500 j/kg-1
MLCAPE: 500 – 1250 j/kg-1
MUCAPE: 750 – 1500 j/kg-1
SRH 0 -1 km: 150 – 250 m2/s2
SRH 0 -3 km: 200 – 350 m2/s2
SRH EFFECTIVE: 200 – 300 m2/s2
L. I.: -3 to -6
SCP: 1.0 – 7.0
STP: 1.0 – 2.3
0 -6 km SHEAR: 60 kts – 70 kts
EFF. SHEAR: 50 kts – 60 kts
MID LEVEL LAPSE RATE: 7.0C – 7.5C
DEWPOINT: 56F – 62F
EHI: 1.6 – 2.7
TOTAL TOTALS INDEX: 52C – 54C
K INDEX: 14C to 32C
SWEAT INDEX: 425 – 470
THOMPSON INDEX: 18 to 39
CRAVEN – BROOKS INDEX: 10,000 – 30,000
CAPE 
ENERGY HELICITY INDEX
K INDEX
TOTAL TOTALS INDEX
STORM RELATIVE HELICITY
LIFTED INDEX
SWEAT VALUES
THOMPSON INDEX
Craven SigSvr Parameter:
The simple product of 100mb MLCAPE and 0-6km magnitude of the vector difference (m/s; often referred to as “deep layer shear”) accounts for the compensation between instability and shear magnitude. Using a database of about 60,000 soundings, the majority of significant severe events (2+ inch hail, 65+ knot winds, F2+ tornadoes) occur when the product exceeds 20,000 m3/s3.
A little fact on SRH values and tornadoes from NOAA / NWS
Storm Relative Helicity (m2 s-2)
SRH (Storm Relative Helicity) is a measure of the potential for cyclonic updraft rotation in right-moving supercells, and is calculated for the lowest 1-km and 3-km layers above ground level. There is no clear threshold value for SRH when forecasting supercells, since the formation of supercells appears to be related more strongly to the deeper layer vertical shear. Larger values of 0-3-km SRH (greater than 250 m2 s-2) and 0-1-km SRH (greater than 100 m2 s-2), however, do suggest an increased threat of tornadoes with supercells. For SRH, larger values are generally better, but there are no clear thresholds between non-tornadic and significant tornadic supercells.
STP ( Significant Tornado Parameter) EXPLAINED:
A majority of significant tornadoes (EF2 or greater damage) have been associated with STP values greater than 1, while most non-tornadic supercells have been associated with values less than 1 in a large sample of RAP analysis proximity soundings.
SCP (Supercell Composite Parameter) EXPLAINED:
A multiple ingredient, composite index that includes effective storm-relative helicity (ESRH, based on Bunkers right supercell motion), most unstable parcel CAPE (muCAPE) and convective inhibition (muCIN), and effective bulk wind difference (EBWD). Each ingredient is normalized to supercell “threshold” values, and larger values of SCP denote greater “overlap” in the three supercell ingredients. Only positive values of SCP are displayed, which correspond to environments favoring right-moving (cyclonic) supercells.
The following are the SCP (Supercell Composite Parameter) and STP (Significant Tornado Parameter) forecast maps from the NAM 3KM model. Generally, the higher the values and brighter the color, indicates a greater probability of strong thunderstorm and / or tornadic activity over an area:
NAM 3KM SCP FORECAST 1:00 P.M. CST FEB. 19– 11:00 P.M. CST FEB. 19
NAM 3KM STP FORECAST 1:00 P.M. CST FEB. 19 – 11:00 P.M. CST FEB. 19
NAM 3KM RADAR SIMULATION 1:00 P.M. CST FEB. 19 – 11:00 P.M. CST FEB. 19
Please use the following maps, which should update automatically, for Mesoscale Discussions and Convective Watches. You may have to refresh your browser, or click on the graphics. I have provided the SPC homepage link below, so you may get the updated information regarding any changes to the outlook:
https://www.spc.noaa.gov/classic.html
SPC MESOSCALE DISCUSSIONS (CLICK IMAGE FOR UPDATES)
SPC CONVECTIVE WATCHES (CLICK IMAGE FOR UPDATES)
IF A TORNADO WARNING IS ISSUED FOR YOUR AREA, TAKE IMMEDIATE SAFE AND STURDY SHELTER!
The following sites will explain most of the severe weather and tornado values listed above, and will give you an idea of what to expect:
ENVIRONMENTAL INDICES AND PARAMETERS NWS
https://www.weather.gov/lmk/indices
THE WEATHER PREDICTION
http://www.theweatherprediction.com/severe/indices/
The following links will connect you to the Excessive Rainfall probabilities and River Flood Outlook:
EXCESSIVE RAINFALL
https://www.wpc.ncep.noaa.gov/qpf/excessive_rainfall_outlook_ero.php
SIGNIFICANT RIVER FLOOD OUTLOOK
https://www.wpc.ncep.noaa.gov/nationalfloodoutlook/index.html
The following NWS Watch / Warning map will provide local NWS information for your area. Click the image, then once it refreshes, click on your area of interest to view forecasts, any special weather statements, hazards or advisories for your area.
NWS WATCH / WARNING DISPLAY (LINKED…CLICK MAP, THEN YOUR AREA)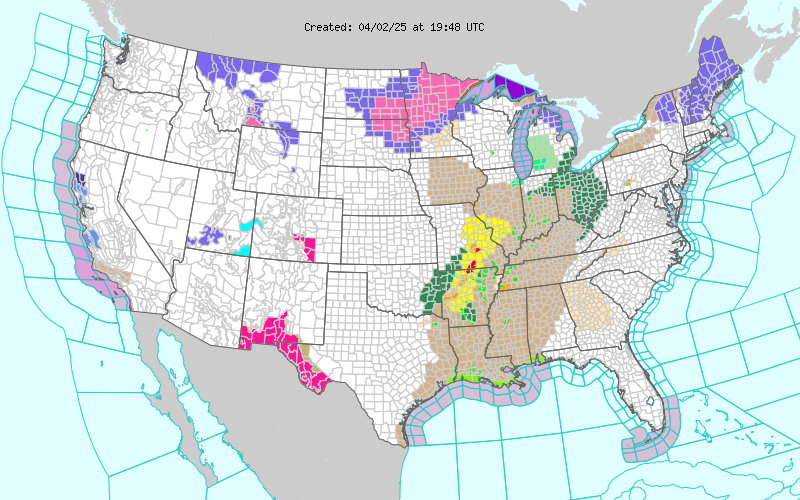
NWS DOPPLER RADAR LOOP (LINKED, CLICK RADAR MAP)
RAP RADAR (CLICK IMAGE THEN GO TO LOOP DURATION AND PICK LENGTH OF LOOP, THEN CLICK RADAR SITE)
WUNDERGROUND RADAR SUMMARY MAP (CLICK FOR UPDATES)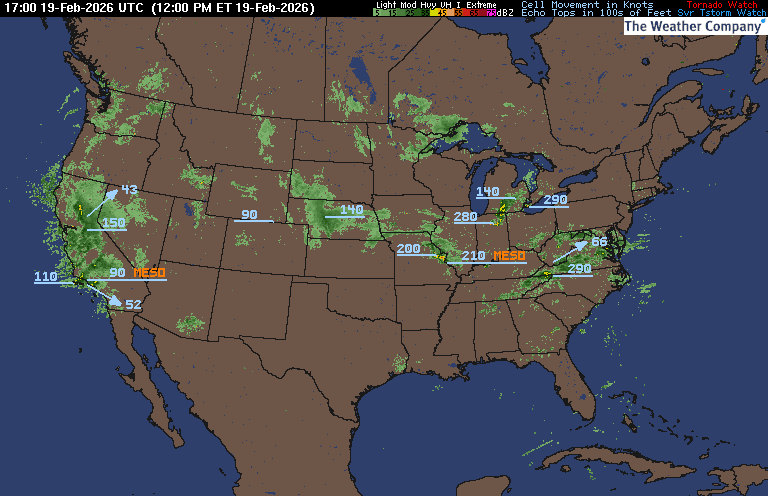
PRECIPITATION TYPE (CLICK TO ACCESS ANIMATION FEATURE)
CARIBBEAN RADAR (CLICK IMAGE TO ACCESS ANIMATION)
You may direct any questions by contacting me personally, ANYTIME, at: twalsh22000@yahoo.com
Have a blessed day!
T. F. “STORM” WALSH III
GMCS, USCG (ret)
METEOROLOGIST / HURRICANE SPECIALIST /SEVERE WEATHER SPECIALIST


.gif)


 English (US) ·
  French (CA) ·