
 4 months ago
131
4 months ago
131
PROTECT YOUR DNA WITH QUANTUM TECHNOLOGY
Orgo-Life the new way to the future Advertising by AdpathwayDisclaimer: This site is not affiliated with the National Hurricane Center, Hurricane Hunters, Storm Prediction Center, or National Weather Service. ALL forecasts herein are the result of my analysis, (to which you will see me at times, insert excerpts from various agencies due to the nature of the importance of the information) and I am solely responsible for the content. As ALWAYS, follow the National Hurricane Center, National Weather Service, and your local Emergency Management officials for emergency decisions. In addition, this is strictly a FORECAST OFFICE. I CANNOT make decisions regarding travel plans, etc. My purpose, is to provide you the information, based solely on information I analyze, and the accuracy of the information at hand of the time of analysis, so you may make informed decisions.
(T. F. “Storm” Walsh)
For those who have donated to my site, your help has been greatly appreciated. If you are not aware, donations to my site help pay for subscriptions to sites I use as well as software updates, which provide all the models and information used in my forecasts. To donate, please click the DONATE button to the right side of the page, or on the graphic of the dog. Any help you provide is immensely appreciated!
DONATIONS ACCEPTED AND APPRECIATED


I will reiterate, my forecasts are based on the available information at the time of analysis, and are only as accurate as the information analyzed and the solutions provided.
Good day everyone!
The Storm Prediction Center (SPC) has issued a SLIGHT risk for severe thunderstorms in the current DAY 1 Outlook: ACROSS CENTRAL AND NORTHEAST OK…FAR SOUTHEAST KS…AND FAR SOUTHWEST MO…
…SPC SUMMARY…
Thunderstorms with a threat for isolated severe wind gusts and a brief tornado will be possible today into tonight from parts of the southern Plains eastward into the low/mid Mississippi and lower Ohio Valleys.
SPC DAY 1 SEVERE THUNDERSTORM OUTLOOK (LINKED FOR OUTLOOK TEXT)
TORNADO PROBABILITY
Probability of a tornado within 25 miles of a point.
HAIL PROBABILITY
Probability of one inch diameter hail or larger within 25 miles of a point.
DAMAGING THUNDERSTORM WIND PROBABILITY
Probability of damaging thunderstorm winds or wind gusts of 50 knots or higher within 25 miles of a point.
CSU – MLP DAY 1 FORECAST (CLICK FOR LARGER IMAGE)
NSSL ML PROBABILITY DAY 1
The SPC indicates a SLIGHT risk for severe weather in the DAY 2 outlook, and a MARGINAL risk in the DAY 3 outlook:
SPC DAY 2 AND DAY 3 OUTLOOK (LINKED TO OUTLOOK TEXT)

CSU – MLP DAY 2 AND 3 VS SPC PROBABILITY FORECAST (CLICK FOR LARGER IMAGE)

NSSL ML DAY 2 AND 3


DAY1 PROBABILITY CONVERSION TABLE
SPC DISCUSSION EXCERPT:
…Southern Plains/Ozarks…
As previously mentioned, a lead vorticity maximum is likely supporting the line of thunderstorms currently ongoing from southwest OK into southwest TX. Expectation is for this line to continue northeastward today, into an airmass that is quickly modifying amid strong low-level moisture advection. Many sites in OK are observing dewpoints 25 to 35 deg F higher than 24 hours ago. Thunderstorms within the line are currently elevated, but there could be a trend towards a more surface-based character over the next few hours amid a combination of increasing low-level moisture and cooling mid-level temperatures. This appears most likely from central OK through northeast OK into far southwest MO and far southeast KS, from around 13Z through 18Z. After 18Z, the quick progression of the shortwave will likely lead to an outpacing of the better low-level moisture return, with dewpoints across much of MO maxing out around 58-60 deg F.
Given the robust shear already in place (recent KTLX VAD sampled over 35 kt of 0-1 km shear and over 55 kt of 0-6 km shear), this potential for surface-based storms will increase the overall risk for damaging wind gusts and/or a brief tornado. Recently issued MCD #0006 addresses the near-term severe potential across this region.
The following maps are from NADOCAST for tornado and hail probabilities.
12Z NADOCAST TORNADO PROBABILITY (CLICK FOR LARGER IMAGE)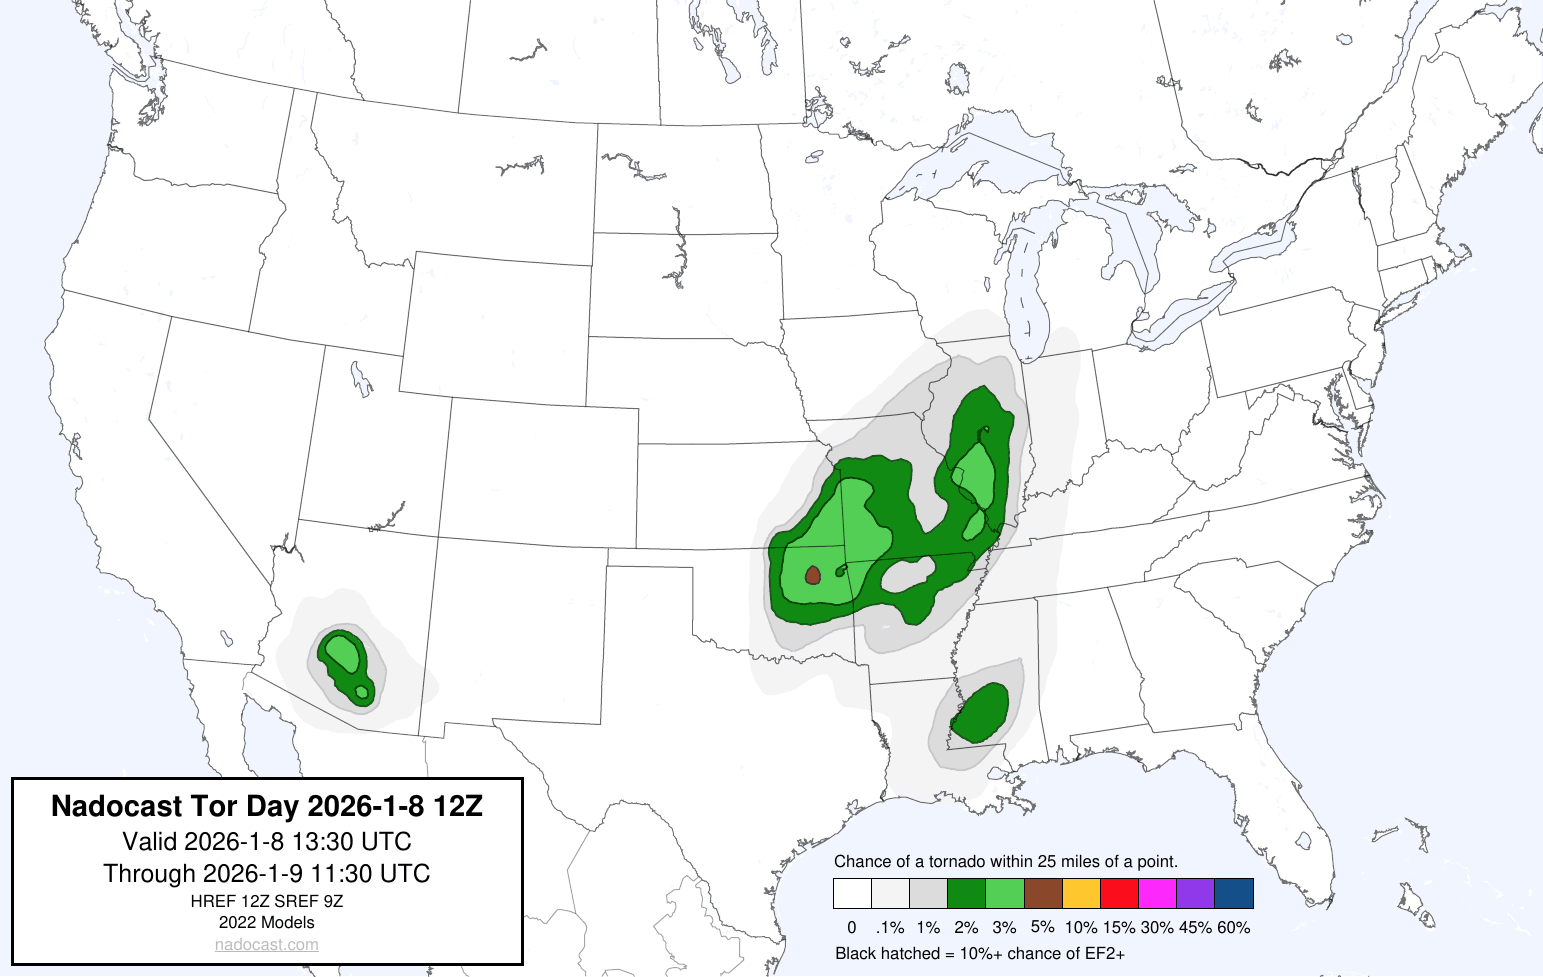
12Z NADOCAST SIGTOR PROBABILITY (CLICK FOR LARGER IMAGE)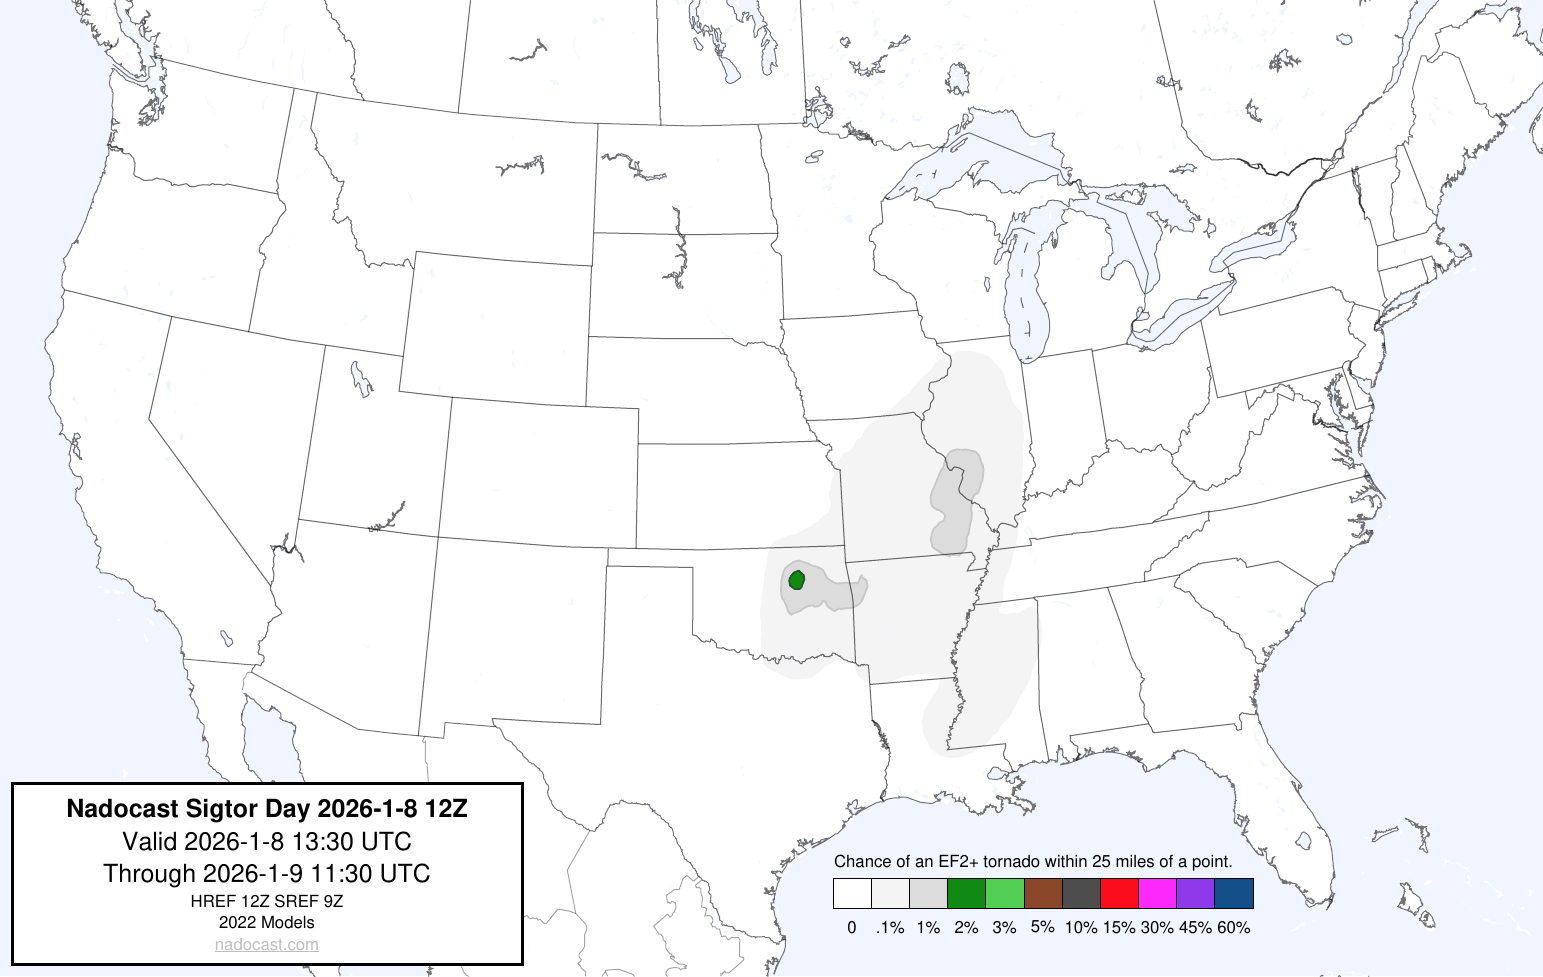
12Z NADOCAST HAIL PROBABILITY (CLICK FOR LARGER IMAGE)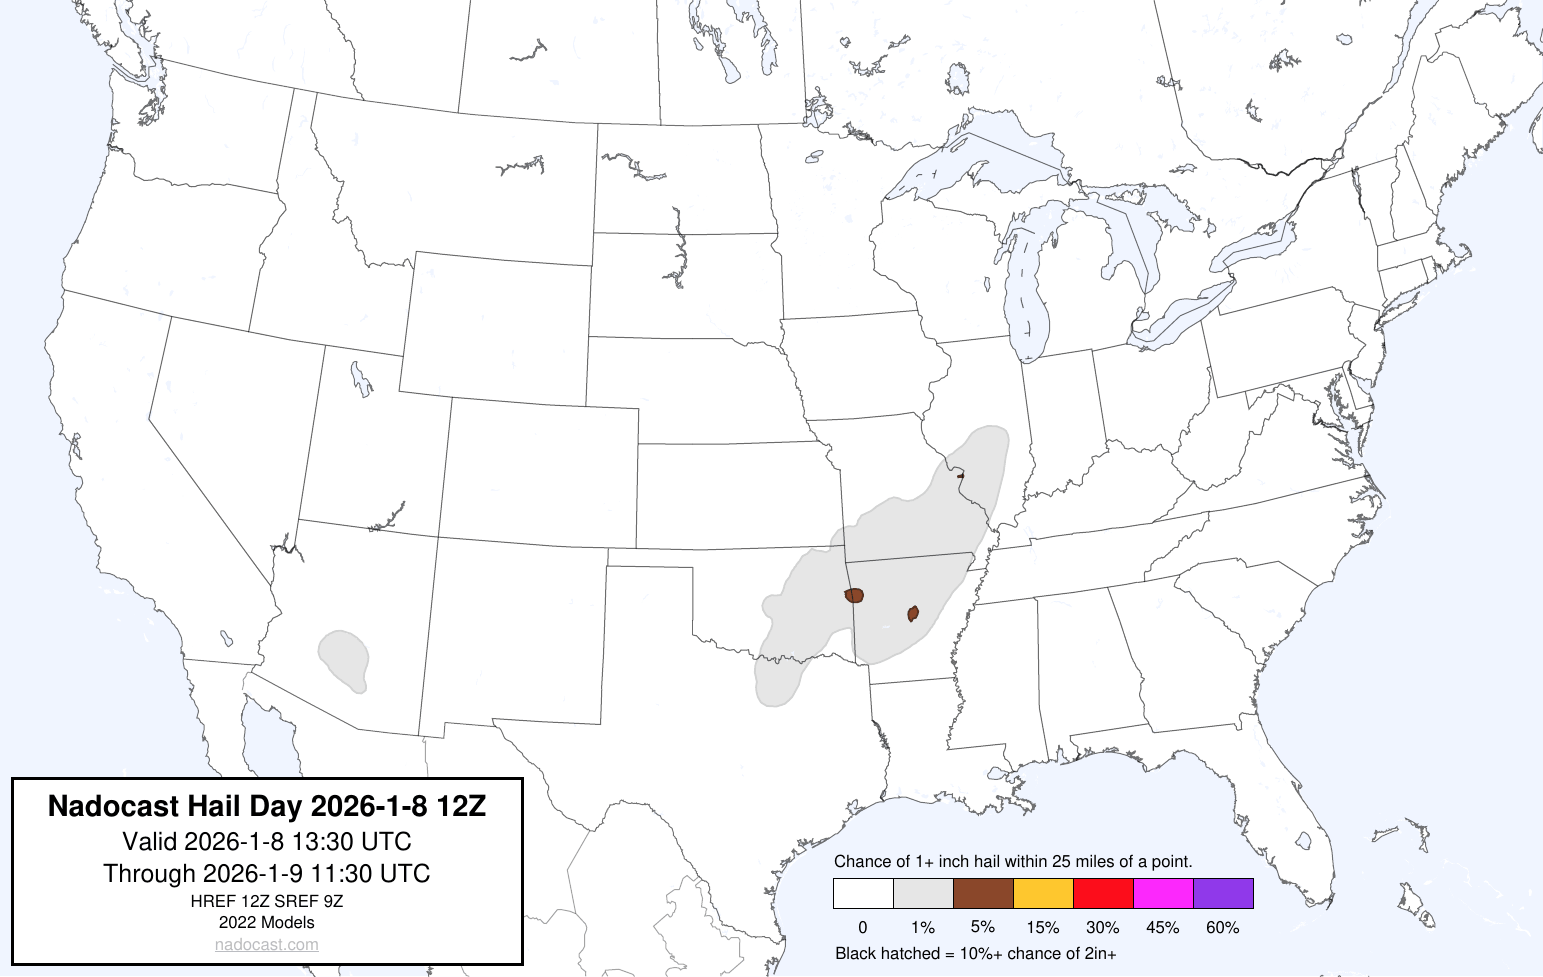
12Z NADOCAST SIGHAIL PROBABILITY (CLICK FOR LARGER IMAGE)
Storms were already in progress from early morning, and continue t0 progress eastward. The forecast for the next 3 days is a little complicated due to already ongoing storms, and suggestions by analyzed information tends to indicate strong storms during each outlook, may be ongoing by early morning, with a probability of some weakening, and re-intensification later in the afternoon hours. Based on my analysis of the severe weather indices, today’s forecast calls for a marginally unstable atmosphere over the risk area. The main threat at this time appears to be damaging thunderstorm winds and gusts, based on bulk shear values, and DCAPE of 500+ j/kg-1, and brief tornado activity, based on bulk shear, 0-3 km SRH, and veering winds with height. . Any tornado activity should remain weak (EF0 – EF1), even though the NADOCAST SIGTOR indicates a probability for stronger. Given the strong bulk shear and the maximum MUCAPE value, along with the slight increase in negative lifted index values, there will be an isolated risk for large hail associated with the strongest storms. The strongest forecast indices and parameters should occur within the SLIGHT risk outline and 5% TORNADO outline, over OK., and over the MARGINAL outline and 2% TORNADO outline within the northern AR. and southern MO. areas. By later tomorrow morning, these indices will be moving into the SLIGHT risk outline in the DAY 2 outlook.
Based on analysis of model animations, the current outlook, and analysis of indices, the strongest convection and indices should occur approximately between 10:00 A.M. CST JAN 08 – 8:00 P.M. CST JAN. 08. Please visit the SPC homepage via the link provided for any changes to the forecast today.
CAPE VALUES FORECAST
DEW POINT FORECAST
Indices were analyzed from the NAM 3KM, HRRR 3KM, CIPS DETERMINISTIC, and SPC SREF model guidance.
The following were the forecast parameters and indices analyzed this morning. Bear in mind, MAXIMUM indices recorded below are for the time of peak intensity. Some indices meanings are posted below the indices themselves, and the NWS page containing a more extensive explanation can be accessed further on in the synopsis:
SBCAPE: 250 – 1000 j/kg-1
MLCAPE: 250 – 500 j/kg-1
MUCAPE: 500 – 750 j/kg-1
SRH 0 -1 km: 100 – 300 m2/s2
SRH 0 -3 km: 200 – 400 m2/s2
SRH EFFECTIVE: 100 – 300 m2/s2
L. I.: -1 to -3
SCP: 1.0 – 3.0
STP: 0.3 – 2.0
0 -6 km SHEAR: 60 kts – 70 kts
EFF. SHEAR: 40 kts – 60kts
MID LEVEL LAPSE RATE: 6.0C – 7.5C
DEWPOINT: 55F – 65F
EHI: 0.5 – 1.0
TOTAL TOTALS INDEX: 48C
K INDEX: 22C to 34C
SWEAT INDEX: 425 – 485
THOMPSON INDEX: 23 to 37
CRAVEN – BROOKS INDEX: 10,000 – 20,000
CAPE 
ENERGY HELICITY INDEX
K INDEX
TOTAL TOTALS INDEX
STORM RELATIVE HELICITY
LIFTED INDEX
SWEAT VALUES
THOMPSON INDEX
Craven SigSvr Parameter:
The simple product of 100mb MLCAPE and 0-6km magnitude of the vector difference (m/s; often referred to as “deep layer shear”) accounts for the compensation between instability and shear magnitude. Using a database of about 60,000 soundings, the majority of significant severe events (2+ inch hail, 65+ knot winds, F2+ tornadoes) occur when the product exceeds 20,000 m3/s3.
A little fact on SRH values and tornadoes from NOAA / NWS
A little fact on SRH values and tornadoes from NOAA / NWS
Storm Relative Helicity (m2 s-2)
SRH (Storm Relative Helicity) is a measure of the potential for cyclonic updraft rotation in right-moving supercells, and is calculated for the lowest 1-km and 3-km layers above ground level. There is no clear threshold value for SRH when forecasting supercells, since the formation of supercells appears to be related more strongly to the deeper layer vertical shear. Larger values of 0-3-km SRH (greater than 250 m2 s-2) and 0-1-km SRH (greater than 100 m2 s-2), however, do suggest an increased threat of tornadoes with supercells. For SRH, larger values are generally better, but there are no clear thresholds between non-tornadic and significant tornadic supercells.
STP ( Significant Tornado Parameter) EXPLAINED:
A majority of significant tornadoes (EF2 or greater damage) have been associated with STP values greater than 1, while most non-tornadic supercells have been associated with values less than 1 in a large sample of RAP analysis proximity soundings.
SCP (Supercell Composite Parameter) EXPLAINED:
A multiple ingredient, composite index that includes effective storm-relative helicity (ESRH, based on Bunkers right supercell motion), most unstable parcel CAPE (muCAPE) and convective inhibition (muCIN), and effective bulk wind difference (EBWD). Each ingredient is normalized to supercell “threshold” values, and larger values of SCP denote greater “overlap” in the three supercell ingredients. Only positive values of SCP are displayed, which correspond to environments favoring right-moving (cyclonic) supercells.
The following are the SCP (Supercell Composite Parameter) and STP (Significant Tornado Parameter) forecast maps from the NAM 3KM model. Generally, the higher the values and brighter the color, indicates a greater probability of strong thunderstorm and / or tornadic activity over an area:
NAM 3KM SCP FORECAST 10:00 A.M. CST JAN. 08 – 8:00 P.M. CST JAN. 08
NAM 3KM STP FORECAST 10:00 A.M. CST JAN. 08 – 8:00 P.M. CST JAN. 08
HRRR 3KM SCP FORECAST 10:00 A.M. CST JAN. 08 – 8:00 P.M. CST JAN. 08
HRRR 3KM STP FORECAST 10:00 A.M. CST JAN. 08 – 8:00 P.M. CST JAN. 08
Please use the following maps, which should update automatically, for Mesoscale Discussions and Convective Watches. You may have to refresh your browser, or click on the graphics. I have provided the SPC homepage link below, so you may get the updated information regarding any changes to the outlook:
https://www.spc.noaa.gov/classic.html
SPC MESOSCALE DISCUSSIONS (CLICK IMAGE FOR UPDATES)
SPC CONVECTIVE WATCHES (CLICK IMAGE FOR UPDATES)
IF A TORNADO WARNING IS ISSUED FOR YOUR AREA, TAKE IMMEDIATE SAFE AND STURDY SHELTER!
The following sites will explain most of the severe weather and tornado values listed above, and will give you an idea of what to expect:
ENVIRONMENTAL INDICES AND PARAMETERS NWS
https://www.weather.gov/lmk/indices
THE WEATHER PREDICTION
http://www.theweatherprediction.com/severe/indices/
The following links will connect you to the Excessive Rainfall probabilities and River Flood Outlook:
EXCESSIVE RAINFALL
https://www.wpc.ncep.noaa.gov/qpf/excessive_rainfall_outlook_ero.php
SIGNIFICANT RIVER FLOOD OUTLOOK
https://www.wpc.ncep.noaa.gov/nationalfloodoutlook/index.html
The following NWS Watch / Warning map will provide local NWS information for your area. Click the image, then once it refreshes, click on your area of interest to view forecasts, any special weather statements, hazards or advisories for your area.
NWS WATCH / WARNING DISPLAY (LINKED…CLICK MAP, THEN YOUR AREA)
NWS DOPPLER RADAR LOOP (LINKED, CLICK RADAR MAP)
RAP RADAR (CLICK IMAGE THEN GO TO LOOP DURATION AND PICK LENGTH OF LOOP, THEN CLICK RADAR SITE)
WUNDERGROUND RADAR SUMMARY MAP (CLICK FOR UPDATES)
PRECIPITATION TYPE (CLICK TO ACCESS ANIMATION FEATURE)
CARIBBEAN RADAR (CLICK IMAGE TO ACCESS ANIMATION)
You may direct any questions by contacting me personally, ANYTIME, at: twalsh22000@yahoo.com
Have a blessed day!
T. F. “STORM” WALSH III
GMCS, USCG (ret)
METEOROLOGIST / HURRICANE SPECIALIST /SEVERE WEATHER SPECIALIST


 English (US) ·
  French (CA) ·