
 1 month ago
373
1 month ago
373
PROTECT YOUR DNA WITH QUANTUM TECHNOLOGY
Orgo-Life the new way to the future Advertising by AdpathwayDisclaimer: This site is not affiliated with the National Hurricane Center, Hurricane Hunters, Storm Prediction Center, or National Weather Service. ALL forecasts herein are the result of my analysis, (to which you will see me at times, insert excerpts from various agencies due to the nature of the importance of the information) and I am solely responsible for the content. As ALWAYS, follow the National Hurricane Center, National Weather Service, and your local Emergency Management officials for emergency decisions. In addition, this is strictly a FORECAST OFFICE. I CANNOT make decisions regarding travel plans, etc. My purpose, is to provide you the information, based solely on information I analyze, and the accuracy of the information at hand of the time of analysis, so you may make informed decisions.
(T. F. “Storm” Walsh)
For those who have donated to my site, your help has been greatly appreciated. If you are not aware, donations to my site help pay for subscriptions to sites I use as well as software updates, which provide all the models and information used in my forecasts. To donate, please click the DONATE button to the right side of the page, or on the graphic of the dog. Any help you provide is immensely appreciated!
DONATIONS ACCEPTED AND APPRECIATED


I will reiterate, my forecasts are based on the available information at the time of analysis, and are only as accurate as the information analyzed and the solutions provided.
Good day everyone!
The forecast center is closed on Sunday’s.
IF 1300Z SPC outlook graphics are utilized, please check the SPC site for any updates to the outline risks when they are issued. 1630Z updates post at approximately 12:30 p.m.
The SPC indicates severe weather risk for Sat.
ALL IMAGES LINKED:
DAY 2
The Storm Prediction Center (SPC) has issued an ENHANCED risk for severe thunderstorms in the current DAY1 Outlook: FROM PARTS OF THE UPPER AND MID MISSISSIPPI VALLEY SOUTHWESTWARD INTO KANSAS AND OKLAHOMA…
…SPC SUMMARY…
Surface analysis this morning depicts a front bisecting MN north to south to a low near the NE-IA-SD border, with the front extending southwestward into the central High Plains. Water-vapor imagery shows a prominent upper trough near the MT-ND border south-southwestward into eastern UT. A belt of increasingly strong southwesterly 500-mb flow will overspread a destabilizing warm sector today as the upper trough eventually reaches the Upper Midwest and central Great Plains late tonight. Concurrently, the aforementioned cyclone will develop northeast to Lake Superior as a warm front over IA advances northward into the western Great Lakes. Meanwhile, the cold front will sweep southeast reaching the central Great Lakes southwestward into the southern Great Plains by early Saturday.
1300Z SPC DAY 1 SEVERE THUNDERSTORM OUTLOOK (LINKED FOR OUTLOOK TEXT)
TORNADO PROBABILITY
Probability of a tornado within 25 miles of a point. Hatched area: a 10% or greater probability of EF2 – EF5 tornadoes within 25 miles of a point
HAIL PROBABILITY
Probability of one inch diameter hail or larger within 25 miles of a point. Hatched area: a 10% or greater probability of 2 – inch diameter or larger hail within 25 miles of a point
DAMAGING THUNDERSTORM WIND PROBABILITY
Probability of damaging thunderstorm winds or wind gusts of 50 knots or higher within 25 miles of a point. Hatched area: a 10% or greater probability of 65 kt+ winds within 25 miles of a point
CSU – MLP 6 PANEL PROBABILITIES DAY 1 AND DAY 2 (CLICK FOR LARGER IMAGE)
NSSL ML DAY 1 PROBABILITY
CSU – MLP DAY 3 – DAY 8 SEVERE PROBABILITIES (CLICK FOR LARGER IMAGE)

DAY 1 PROBABILITY CONVERSION TABLE
SPC DISCUSSION EXCERPT:
…Upper and Mid Mississippi Valley…
A large-hail threat may develop this morning with developing convection across southern MN (see forthcoming MCD #472 for short-term details). Heating and advection of 60s deg F surface dewpoints beneath steep mid-level lapse rates will support the development of a moderately to very unstable airmass from IA-IL northward into the upper MS Valley to the east of the front and southeast of the low. Upwards of 1500-3000 J/kg MLCAPE is forecast immediately ahead of the front with strengthening flow aloft, strongly favoring organized storms, including supercells. Recent model guidance continues to show the development of discrete supercells later this afternoon ahead of the front over parts of central/northern WI near the low, and farther south in the vicinity of eastern IA into adjacent portions of WI/northwest IL. All hazards will be possible with this potential activity, including the possibility for an intense tornado. Large to giant hail will be possible with supercells. Other storms likely to evolve quickly into a band of severe thunderstorms will develop farther west and push east coincident with the front. Damaging wind gusts will tend to become more prevalent during the evening with linear storm modes. Some tornado risk may continue into the evening as maturing bands of storms yield a threat for bowing segments and embedded mesovortices, before this activity gradually diminishes late as it moves east into IN/Lower MI late.
…KS-OK eastward into the lower MO Valley…
Both a supercell and QLCS tornado risk is apparent given the appreciably large CAPE/shear. A coalescing of cold pools and intensification of a squall line with embedded surges and bowing segments may result in focused swaths of more intense severe gusts (i.e., locally 75-90 mph) from south-central and eastern KS into west-central MO. Farther south, a more conditional setup south of the triple point along the dryline is expected. Large to giant hail could accompany any mature/sustained supercell along with a tornado risk. Eventually the front will sweep southeastward with a convective line yielding a risk for wind/hail.
The following maps are from NADOCAST for tornado and hail probabilities. Click each image for a larger view
12Z NADOCAST TORNADO PROBABILITY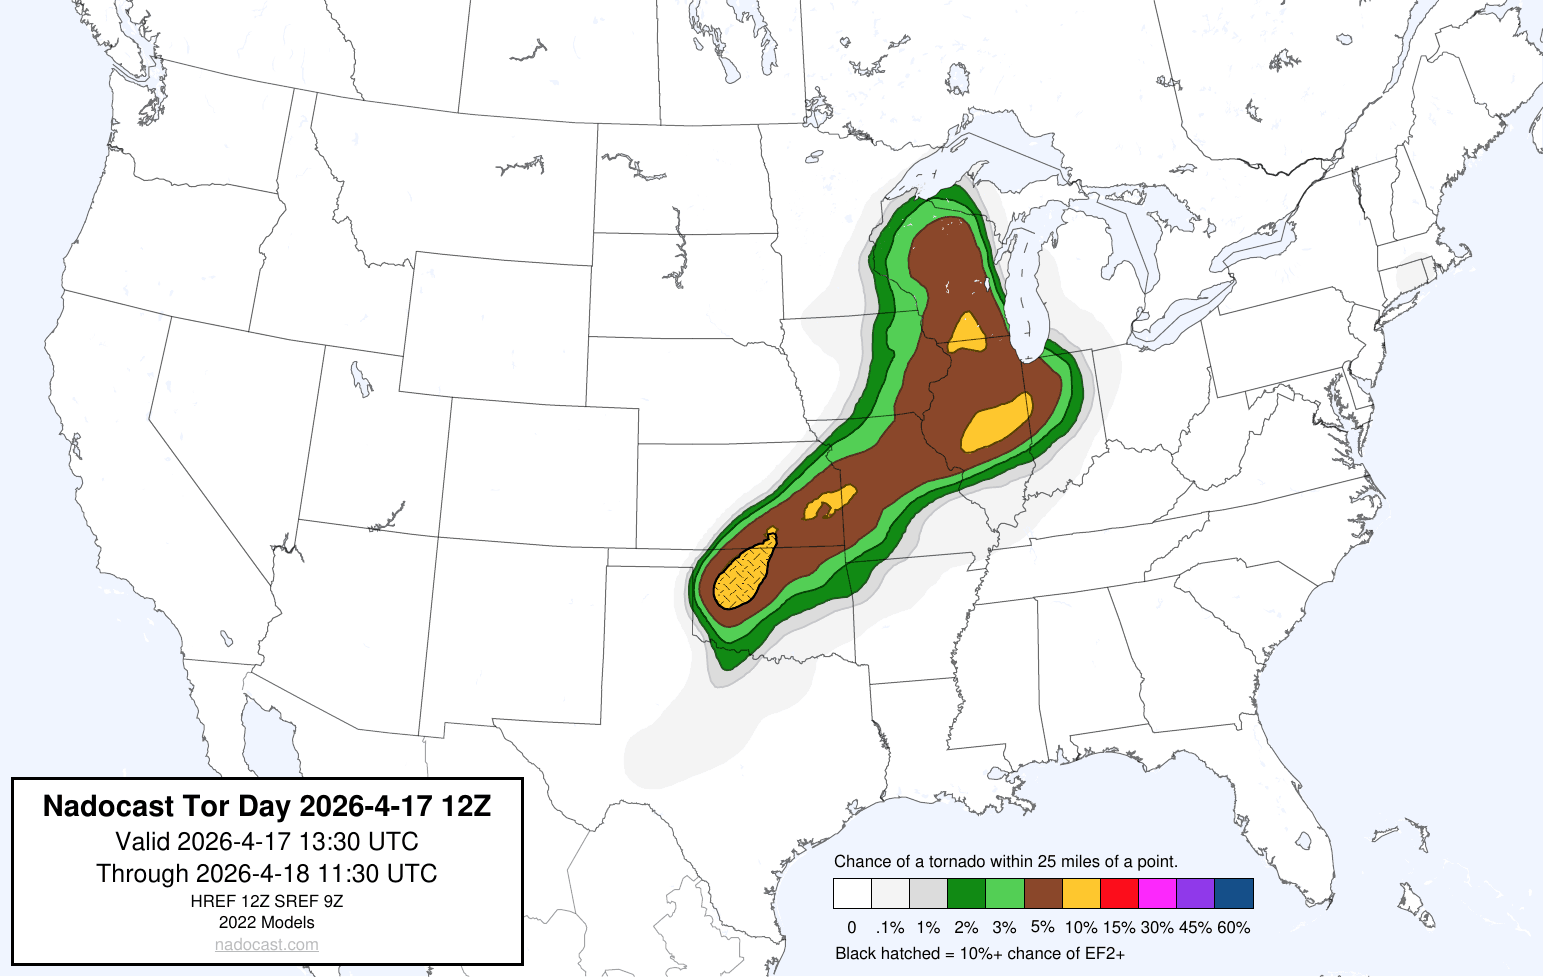
12Z NADOCAST SIGTOR PROBABILITY 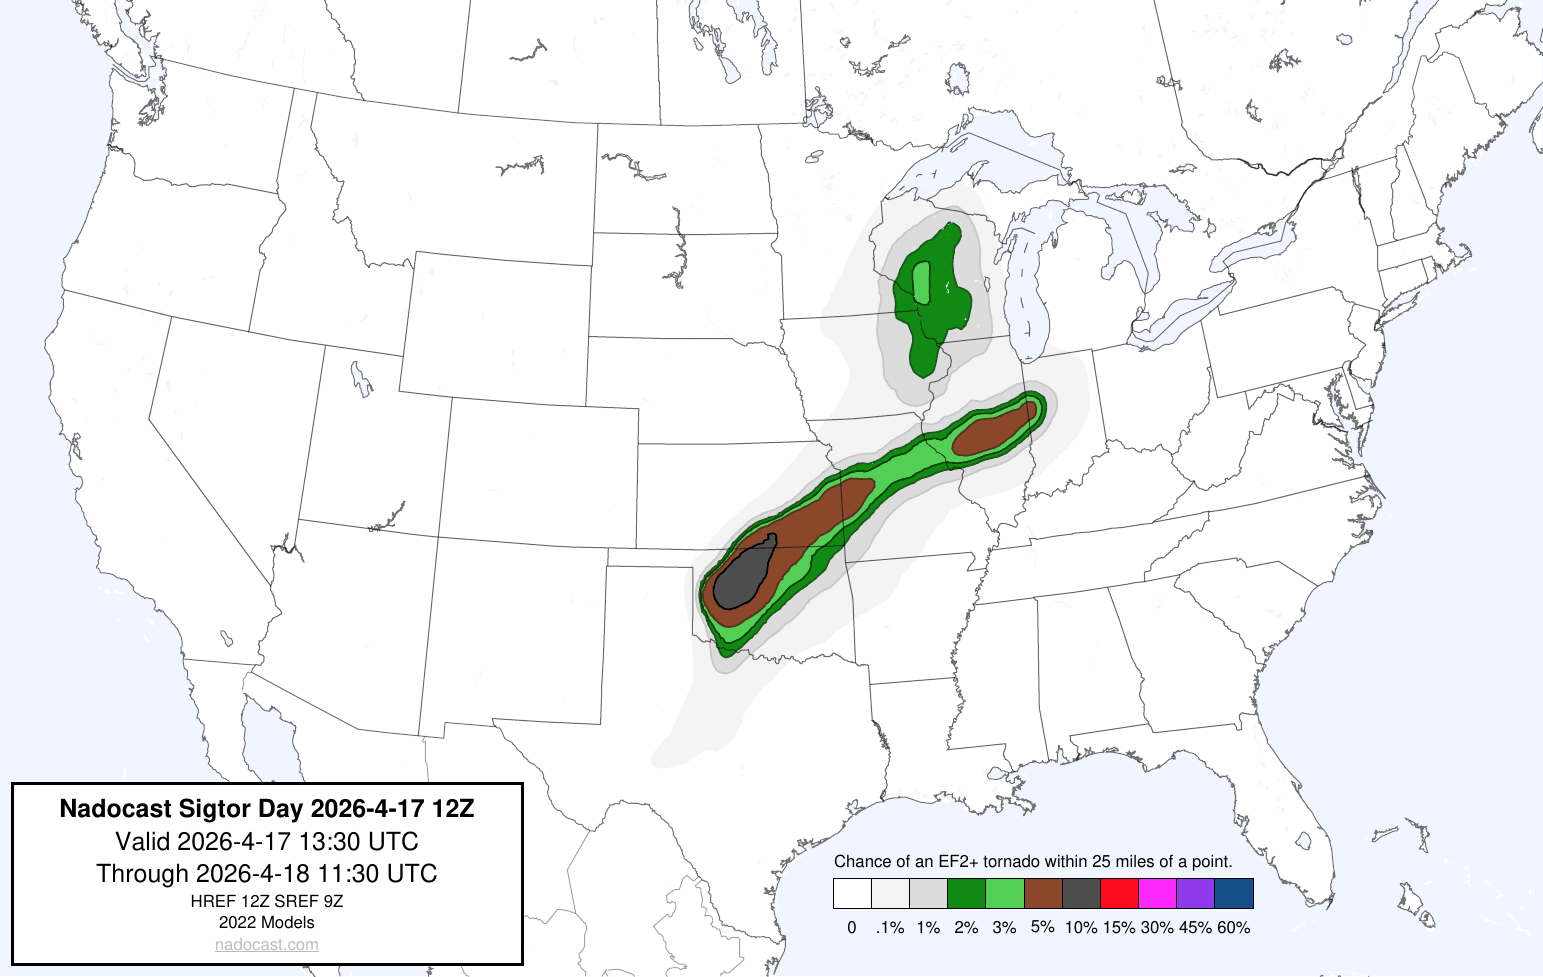
12Z NADOCAST HAIL PROBABILITY 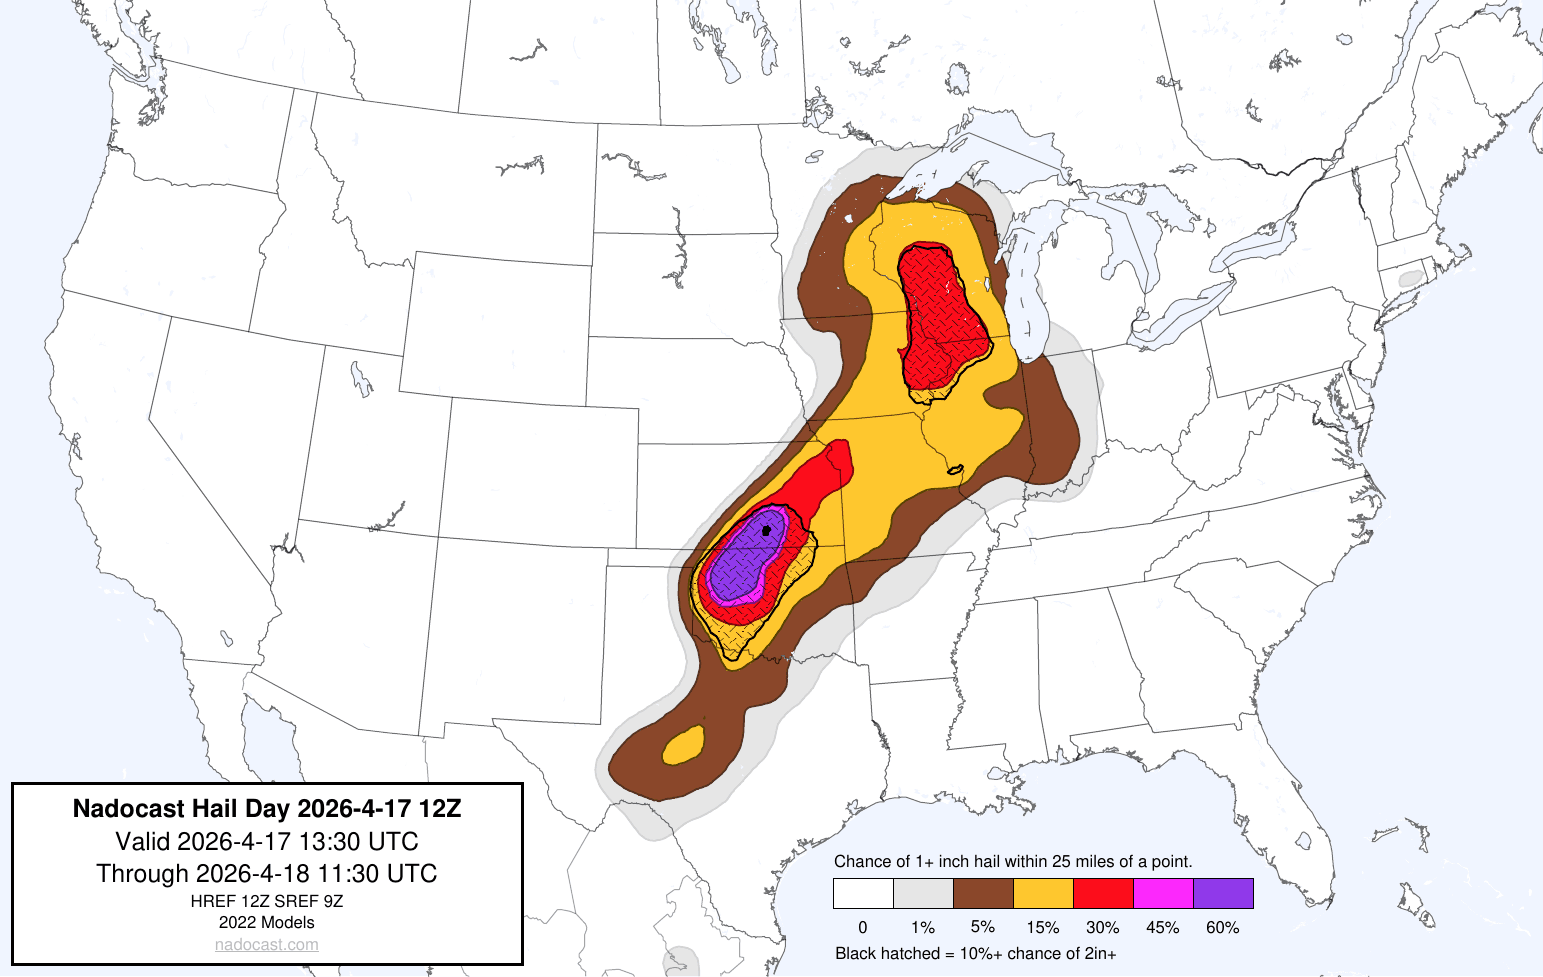
12Z NADOCAST SIGHAIL PROBABILITY 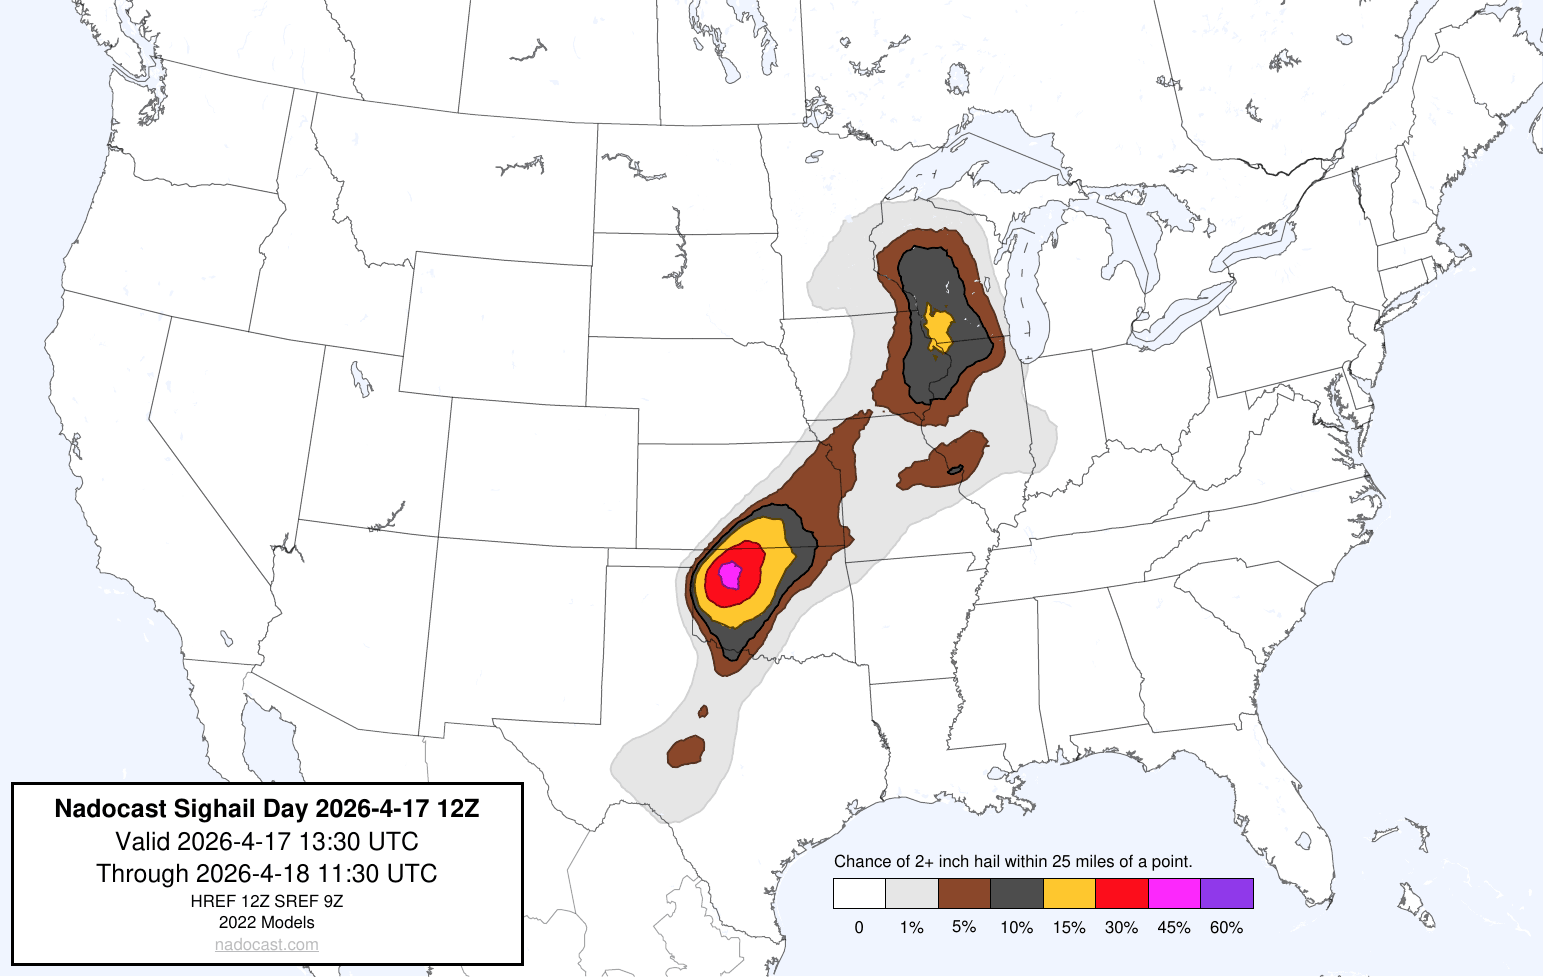
Based on my analysis this morning of the current forecast severe weather indices, the forecast calls for a HIGH END very unstable atmosphere to extremely unstable atmosphere within the ENHANCED risk outline, mainly over the 30% HAIL outlines. The main severe risk as of analysis this morning appears to be very large to significant hail, based on lifted indices, steep mid level lapse rates, and maximum SBCAPE values within the 30% HAIL outlines, damaging thunderstorm winds / gusts, and TORNADOES, possibly on the order of (EF2+) within the SIGNIFICANT HATCHED TORNADO area over Oklahoma, and possibly an ISOLATED (EF4 – EF5), and a greater possibility of isolated (EF4 – EF5) TORNADOES within the 10% SIGNIFICANT HATCHED TORNADO outline over portions of Wisconsin and Iowa based on the SPC outlook maps. Today has a greater potential to become a PDS (Particularly Dangerous Situation) with the possibility of a PDS TORNADO watch being issued later this afternoon.
Based on analysis of mainly model animations, the current outlook, and analysis of indices, the strongest convection and indices should occur approximately between early afternoon into early evening. Please visit the SPC homepage via the link provided for any changes to the forecast today.
CAPE VALUES FORECAST
DEW POINT FORECAST
Indices were analyzed from the NAM 3KM, HRRR 3KM, CIPS DETERMINISTIC, and SPC SREF model guidance.
REGARDING EHI VALUES: While EHI values are calculated utilizing MLCAPE and 0 – 3 km SRH values (MLCAPE x 0 – 3 km SRH /160,000), the highest SRH values do not always fall within ample, highest MLCAPE values for the best probability of tornado activity. I utilize the SRH and MLCAPE values over the area that has the highest tornado risk potential. Maximum EHI values are calculated within the area(s) that have the greatest probability for tornado activity
The following were the forecast parameters and indices analyzed this morning within the ENHANCED risk outline MAINLY over the Wisconsin /Iowa 30% HAIL outline and 10% SIGNIFICANT HATCHED TORNADO region. SBCAPE and LIFTED INDEX parameters were pretty much identical over the Oklahoma region, however MLCAPE and 0-3 km SRH was the highest over Wisconsin and Iowa. Listed indices will always pertain to the area(s) located within the highest SPC risk outlines, especially those areas indicated by SPC to have the greater tornado potential, should multiple severe risk areas appear in the SPC forecast. Although certain indices may appear stronger on a forecast map, given the lack of other indices does not contribute to the overall severe risk. Bear in mind, MAXIMUM indices recorded below are for the time of peak intensity. Some indices meanings are posted below the indices themselves, and the NWS page containing a more extensive explanation can be accessed further on in the synopsis:
SBCAPE: 2000- 4000 j/kg-1
MLCAPE: 1500 – 3000 j/kg-1
MUCAPE: 2000 – 4000 j/kg-1
SRH 0 -1 km: 150 – 200 m2/s2
SRH 0 -3 km: 200 – 350 m2/s2
SRH EFFECTIVE: 100 – 200 m2/s2
L. I.: -5 to -10
SCP: 8 – 24
STP: 0.5 – 3.6
0 -6 km SHEAR: 40 kts – 60 kts
EFF. SHEAR: 35 kts – 50 kts
MID LEVEL LAPSE RATE: 7.5C – 8.5C
DEWPOINT: 59F – 68F
EHI: 1.9 – 6.5
TOTAL TOTALS INDEX: 58C
K INDEX: 24C to 36C
SWEAT INDEX: 635 – 695
THOMPSON INDEX: 29 to 46
CRAVEN – BROOKS INDEX: 40,000 – 70,000
The following are some severe weather parameters and indices explanations:
CAPE 
ENERGY HELICITY INDEX
K INDEX
TOTAL TOTALS INDEX
STORM RELATIVE HELICITY
LIFTED INDEX
SWEAT VALUES
THOMPSON INDEX
Craven SigSvr Parameter:
The simple product of 100mb MLCAPE and 0-6km magnitude of the vector difference (m/s; often referred to as “deep layer shear”) accounts for the compensation between instability and shear magnitude. Using a database of about 60,000 soundings, the majority of significant severe events (2+ inch hail, 65+ knot winds, F2+ tornadoes) occur when the product exceeds 20,000 m3/s3.
A little fact on SRH values and tornadoes from NOAA / NWS
Storm Relative Helicity (m2 s-2)
SRH (Storm Relative Helicity) is a measure of the potential for cyclonic updraft rotation in right-moving supercells, and is calculated for the lowest 1-km and 3-km layers above ground level. There is no clear threshold value for SRH when forecasting supercells, since the formation of supercells appears to be related more strongly to the deeper layer vertical shear. Larger values of 0-3-km SRH (greater than 250 m2 s-2) and 0-1-km SRH (greater than 100 m2 s-2), however, do suggest an increased threat of tornadoes with supercells. For SRH, larger values are generally better, but there are no clear thresholds between non-tornadic and significant tornadic supercells.
STP ( Significant Tornado Parameter) EXPLAINED:
A majority of significant tornadoes (EF2 or greater damage) have been associated with STP values greater than 1, while most non-tornadic supercells have been associated with values less than 1 in a large sample of RAP analysis proximity soundings.
SCP (Supercell Composite Parameter) EXPLAINED:
A multiple ingredient, composite index that includes effective storm-relative helicity (ESRH, based on Bunkers right supercell motion), most unstable parcel CAPE (muCAPE) and convective inhibition (muCIN), and effective bulk wind difference (EBWD). Each ingredient is normalized to supercell “threshold” values, and larger values of SCP denote greater “overlap” in the three supercell ingredients. Only positive values of SCP are displayed, which correspond to environments favoring right-moving (cyclonic) supercells.
The following are the SCP (Supercell Composite Parameter) and STP (Significant Tornado Parameter) forecast maps from the NAM 3KM model. Generally, the higher the values and brighter the color, indicates a greater probability of strong thunderstorm and / or tornadic activity over an area:
NAM 3KM SCP FORECAST 1:00 P.M. CDT APR. 17 – MIDNIGHT CDT APR. 18
NAM 3KM STP FORECAST 1:00 P.M. CDT APR. 17 – MIDNIGHT CDT APR. 18  NAM 3KM RADAR SIMULATION 1:00 P.M. CDT APR. 17 – MIDNIGHT CDT APR. 18
Please use the following maps, which should update automatically, for Mesoscale Discussions and Convective Watches. You may have to refresh your browser, or click on the graphics. I have provided the SPC homepage link below, so you may get the updated information regarding any changes to the outlook:
https://www.spc.noaa.gov/classic.html
SPC MESOSCALE DISCUSSIONS (CLICK IMAGE FOR UPDATES)
SPC CONVECTIVE WATCHES (CLICK IMAGE FOR UPDATES)
The following sites will explain most of the severe weather and tornado values listed above, and will give you an idea of what to expect:
ENVIRONMENTAL INDICES AND PARAMETERS NWS
https://www.weather.gov/lmk/indices
THE WEATHER PREDICTION
http://www.theweatherprediction.com/severe/indices/
The following links will connect you to the Excessive Rainfall probabilities and River Flood Outlook:
EXCESSIVE RAINFALL
https://www.wpc.ncep.noaa.gov/qpf/excessive_rainfall_outlook_ero.php
SIGNIFICANT RIVER FLOOD OUTLOOK
https://www.wpc.ncep.noaa.gov/nationalfloodoutlook/index.html
The following NWS Watch / Warning map will provide local NWS information for your area. Click the image, then once it refreshes, click on your area of interest to view forecasts, any special weather statements, hazards or advisories for your area.
IF A TORNADO WARNING IS ISSUED FOR YOUR AREA…SEEK STURDY AND SAFE SHELTER IMMEDIATELY!
NWS WATCH / WARNING DISPLAY (LINKED…CLICK MAP, THEN YOUR AREA)
NWS DOPPLER RADAR LOOP (LINKED, CLICK RADAR MAP)
RAP RADAR (CLICK IMAGE THEN GO TO LOOP DURATION AND PICK LENGTH OF LOOP, THEN CLICK RADAR SITE)
WUNDERGROUND RADAR SUMMARY MAP (CLICK FOR UPDATES)
PRECIPITATION TYPE (CLICK TO ACCESS ANIMATION FEATURE)
CARIBBEAN RADAR (CLICK IMAGE TO ACCESS ANIMATION)
You may direct any questions by contacting me personally, ANYTIME, at: twalsh22000@yahoo.com
Have a blessed day!
T. F. “STORM” WALSH III
GMCS, USCG (ret)
METEOROLOGIST / HURRICANE SPECIALIST /SEVERE WEATHER SPECIALIST


 English (US) ·
  French (CA) ·